
Direct answer
TDLAS converts absorption at selected molecular lines into a gas amount under a defined optical model.
A tunable laser is scanned across an absorption feature. The detector records transmitted light, and the algorithm fits or demodulates the feature using line strength, line shape, pressure, temperature, optical path and calibration information.
TDLAS does not by itself guarantee a representative sample, prevent optical fouling, define the host interface or make an alarm safe. Those functions belong to the complete measurement chain.
1. Locate TDLAS inside the complete measurement chain
A useful analyser contains more than a laser and detector. The chain begins with selecting a molecular transition that has enough strength and acceptable interference. It continues through laser current/temperature control, beam delivery, process or sample cell, detector, analogue front end, scan timing, spectral recovery, pressure/temperature correction, calibration and diagnostics. A host then scales, displays, communicates or acts on the result.
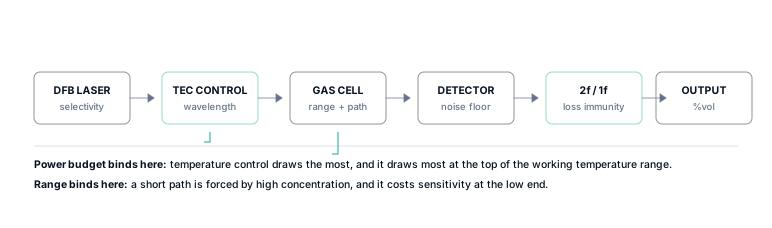
The choice between an insertion module and a box-level extractive module changes the gas-path part of that chain. The underlying optical method can be similar, while pressure, sample transport, contamination and host responsibilities are completely different.
2. Beer–Lambert absorption is the physical starting point
When light at frequency ν passes through an absorbing gas, transmitted intensity can be written as:
The absorption feature identifies the molecule through its spectroscopy, while the magnitude is related to the amount of absorber along the optical path. A concentration result therefore depends on line data, path length, pressure, temperature and the way background and overlapping features are treated.
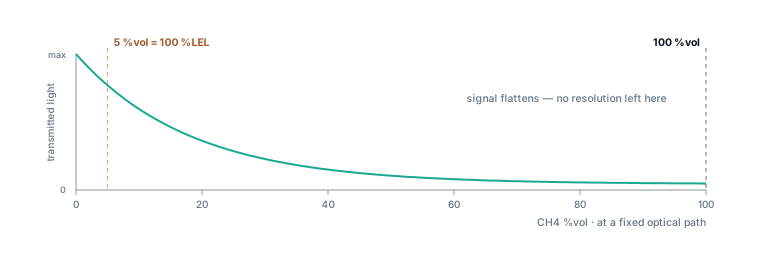
“Laser measurement” is not one generic performance level. A weak line may improve high-concentration headroom but reduce low-end signal. A strong line or long path improves sensitivity but can saturate at high concentration. The relevant spectral neighbourhood and detector response also matter.
3. The algorithm recovers a small absorption feature from a changing optical signal
Direct absorption spectroscopy can fit the transmitted line profile. Wavelength-modulation spectroscopy moves the laser wavelength around the line and demodulates harmonics to improve rejection of some baseline noise. Either approach needs scan linearity, laser-temperature control, detector linearity, optical background and calibration to remain within a defined envelope.
A review article in Frontiers in Physics describes line selection, optical path, demodulation and background treatment as linked design choices. That is why an algorithm cannot be separated from the optical hardware and test matrix when evidence is handed over.
4. What the TDLAS module can own
| Function | Typical module responsibility | Condition required |
|---|---|---|
| Laser control | Wavelength scan and thermal stabilisation | Operating temperature and power within envelope |
| Optical detection | Received-light measurement and analogue conversion | Optical path and contamination within limits |
| Spectral recovery | Fit/demodulate selected absorption feature | Pressure, temperature and background model valid |
| Concentration output | Configured units, range and status | Calibration and test conditions traceable |
| Self-diagnostics | Selected optical, thermal, sensor and communication states | Host must interpret and act on them correctly |
5. What remains outside the optical method
- Whether the gas at the optical path represents the process location of interest.
- Sample-line material, pump, filters, heating, drying, pressure regulation and exhaust for an extractive analyser.
- Process fitting, insertion position, isolation and cleaning for an in-pipe module.
- Host power quality, display, data logging, alarm, interlock, latching and communication supervision.
- Enclosure ingress protection, hazardous-area association, field wiring and final system approval.
- Site calibration, maintenance, proof testing and the decision to continue or stop operation.
6. Verify the complete chain in layers
Cell-level tests can isolate optical performance. Module tests add electronics, thermal behaviour and firmware. Analyser tests add sample handling and host interface. Site tests add the real process location and operating procedures. Results from one layer should not be relabelled as evidence for all layers.
| Layer | Example test | Claim supported |
|---|---|---|
| Optical bench | Line selection, signal-to-noise and pressure/temperature matrix | Design feasibility and algorithm model |
| Module | Accuracy, response, power, environment and diagnostics | Controlled module specification |
| Host analyser | Full sample path, output scaling, alarms and faults | Integrated instrument performance |
| Site | Representative location, contamination, maintenance and cause-and-effect | Application acceptance within approved scope |
7. Common failure modes
Line selectivity becomes system selectivity
A clean laboratory mixture is used to ignore pressure, water, neighbouring lines or contamination in the real gas matrix.
Optical response becomes process response
A fast cell result is quoted while a remote sample line dominates the field delay.
Concentration without validity
The host receives a number but not the optical, pressure or algorithm diagnostics needed to reject it.
Technology name replaces test evidence
“TDLAS” is used as a guarantee of drift, accuracy or maintenance without product- and condition-specific results.
Primary and official sources
Sources were checked for the specific claims used here. A cited source does not endorse Specval or establish product performance.
- NIST TDLAS measurement paper — Beer–Lambert formulation, in-situ optical measurement and system considerations.
- NIST high-resolution absorption publication — absorption line shape, pressure broadening and spectral analysis.
- Frontiers in Physics review of TDLAS — line selection, optical paths, wavelength modulation, demodulation and application variables.
Technical review date: 30 July 2026.