
Direct answer
Treat 0–100 %vol as the outer reporting span, not a complete performance statement.
To qualify a high-concentration methane measurement, add the normal working band, low and high accuracy segments, optical path, pressure/temperature conditions, background gas, response requirement and the concentration at which a decision is made.
A design that preserves signal at 100 %vol may sacrifice low-end sensitivity. That is why one full-scale percentage rarely describes performance coherently across four or five orders of concentration.
1. Separate four concentration statements
A range conversation becomes useful when it distinguishes the outer reporting span from the region where the process usually operates. High-concentration gas drainage can occupy a broad band: a US EPA coal-mine methane paper reports that gob gas may contain approximately 30–95% methane, but the actual composition varies with mine, drainage method and air ingress. That contextual range does not replace site data.
| Band | Meaning | Project question |
|---|---|---|
| Full stated range | Outer span intended to be reported | Can the system represent all expected values without over-range? |
| Normal working band | Where the process spends most operating time | Where should accuracy, stability and response be strongest? |
| Decision band | Region around warning, control or shutdown action | Does uncertainty change the operational decision? |
| Verification points | Concentrations used for calibration or test | Do the points cover the low segment, normal band and decision region? |
A project may need 0–100 %vol to survive dilution or calibration events while normally operating at 35–70 %vol. Another may need low-percent sensitivity because a protective decision sits near the bottom of the high-concentration range. The same range label hides those differences.
2. Optical path and concentration form one design variable
Beer–Lambert absorption can be expressed using transmittance τ and absorbance A:
A = −ln(τ) ≈ S(T) · N · L For an isolated line after integrating the line shape, absorbance grows with absorber amount and optical path.
At high concentration, a long optical path or strong absorption line can leave very little transmitted light near line centre. Once the useful part of the feature approaches detector noise or is distorted by saturation and neighbouring absorption, more absorbance is not more information. A shorter path or weaker line preserves dynamic range but reduces low-concentration signal.
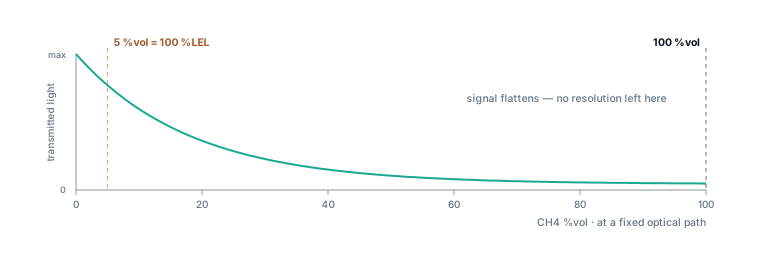
The current pipeline insertion target uses a short 40 mm flow-through measurement window to support a high-concentration CH₄ direction. The range claim therefore cannot be copied to a different path length, absorption line, pressure band or detector without re-verification.
3. Use segmented accuracy instead of one percentage of full scale
A single ±1% of full scale on a 0–100 %vol range would mean ±1 %vol everywhere. That is very loose at low concentration. Conversely, one relative percentage becomes unrealistically tight near zero. A segmented statement uses absolute error in the low region and relative error where readings are high enough.
| Segment | Target accuracy | Examples |
|---|---|---|
| 0–1.00 %vol | ±0.05 %vol | 0.20 indicated → simple band 0.15–0.25 %vol |
| 1.00–100 %vol | ±3.5% of reading | 40 indicated → ±1.40 %vol; 80 indicated → ±2.80 %vol |
| Transition at 1.00 %vol | Use the wider declared tolerance | Low segment gives ±0.05 %vol; high calculation gives ±0.035 %vol |
These numbers are current engineering targets under conditions still to be locked in a test plan. Resolution—0.01 %vol in the low segment and 0.1 %vol in the high segment—is only display or reporting granularity. It must not be substituted for accuracy or detection limit.
4. Check the range at the concentration that changes action
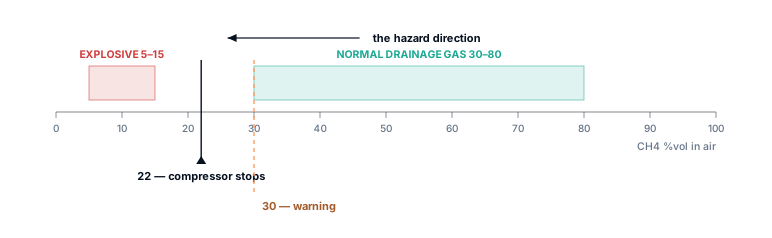
If a reading informs a threshold, calculate the absolute specification band there. At 22 %vol, the current high-segment target gives:
simple band: 21.23–22.77 %vol This is not a complete system uncertainty budget and does not determine the legal setpoint.
The relevant design question is not whether the display can show 22.0. It is how the host logic behaves when the true concentration may be on either side of the action point, especially while the process is changing. Pressure compensation, calibration gas uncertainty, drift, sampling/location error, response lag and signal transmission add to the module accuracy statement.
5. Distribute verification points by use, not evenly by full scale
Ten evenly spaced points from 0 to 100 %vol may miss the low-segment transition and the operational threshold. A more useful matrix includes zero response, low-segment points, the 1 %vol transition, points around the project threshold, several points in the normal working band and an upper-range point. Repeat selected points across pressure and temperature extremes.
6. Common failure modes
Full range mistaken for normal operation
The design is optimised at 0 and 100 %vol while the project decision sits in a narrow mid-range band.
Resolution marketed as accuracy
A display shows 0.01 %vol increments, but the uncertainty is several increments or more.
One accuracy form used everywhere
Percentage of full scale hides low-end weakness; percentage of reading becomes implausible near zero.
Range copied across pressure
A high-concentration optical path is checked near atmospheric pressure but used under deep vacuum without spectral compensation evidence.
7. Minimum project inputs
- Full expected range, normal working band, excursions and the fraction of time spent in each region.
- Concentration points tied to warning, control, shutdown, utilisation or commercial decisions.
- Absolute pressure and temperature across the concentration band.
- Background gas, water, oxygen, carbon dioxide and other possible spectral interferents.
- Required accuracy form at low concentration and relative accuracy in the normal high band.
- Calibration and verification gases available at the actual target concentrations.
Primary and official sources
Sources were checked for the specific claims used here. A cited source does not endorse Specval or establish product performance.
- NIST TDLAS measurement paper — Beer–Lambert relationship among absorption, number density and optical path.
- NIST high-resolution absorption publication — line strength, line shape and pressure-dependent absorption analysis.
- US EPA coal-mine methane paper — contextual methane concentration range reported for gob gas; site conditions still govern.
Technical review date: 30 July 2026.