
Direct answer
There is no universal winner; compare the implementations against one gas matrix and one decision task.
TDLAS usually scans a narrow laser across selected absorption lines, while NDIR uses a broader infrared source with spectral filtering and one or more detector channels. TDLAS can offer strong spectral discrimination and detailed line-shape modelling; NDIR can offer a compact, simpler optical architecture.
Actual range, accuracy, pressure sensitivity, drift, cost and maintenance belong to the specific instrument—not to the technology name alone.
1. Both infer gas from infrared absorption
Both methods send infrared radiation through a gas and observe wavelength-dependent attenuation. The same fundamental questions remain: which molecular feature is used, how long the path is, what pressure and temperature do to absorption, what else is in the gas, how the baseline changes and whether the gas at the cell represents the process.
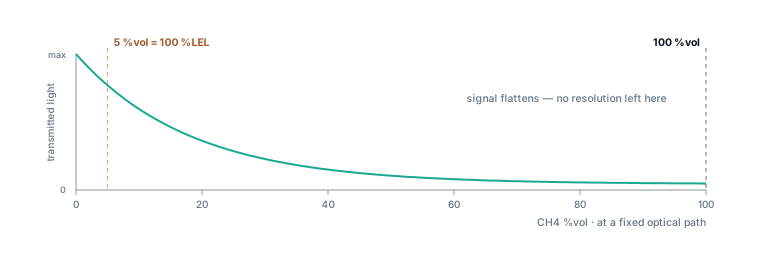
absorbance A(λ) = −ln[τ(λ)] The instrument architecture determines how wavelength information and reference intensity are produced and stabilised.
2. They distribute spectral selectivity differently
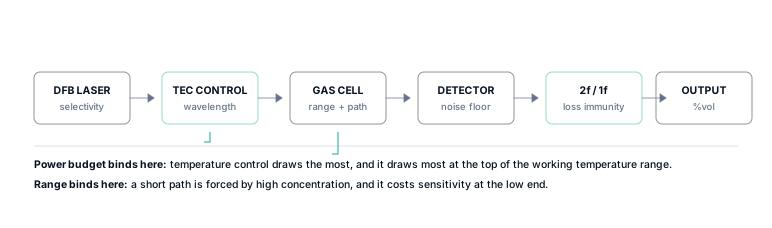
A TDLAS instrument tunes a relatively narrow-linewidth laser through a selected transition or small spectral region. It can analyse the shape or modulated harmonics of that feature. Laser wavelength, current, temperature and scan behaviour therefore become critical components.
An NDIR instrument normally uses a broadband infrared source, an optical bandpass filter and detector channel, often with a reference channel. The filter and detector integrate absorption across a wider spectral band. Source ageing, detector/filter stability, contamination and reference-channel treatment become central design topics.
A primary methane NDIR sensor study available through the US National Library of Medicine shows how source, optical cell, filters, detector and signal processing form a complete NDIR design. A published TDLAS/NDIR comparison in Sensors demonstrates that performance conclusions depend on the tested instruments and conditions rather than on labels alone.
3. Compare dimensions that can be tested
| Dimension | TDLAS implementation | NDIR implementation |
|---|---|---|
| Spectral selection | Narrow laser scan around chosen line(s) | Filter/detector integrates a broader band |
| Source control | Laser current, temperature, wavelength and scan linearity | Broadband source output, modulation and ageing |
| Interference treatment | Line selection and spectral-fit/modulation residuals can help distinguish features | Filter band, reference channel and multi-channel compensation define discrimination |
| Pressure / temperature | Can explicitly model line strength and shape when sensors and validation support it | Requires calibration/compensation for band-integrated response and gas density |
| High concentration | Line strength and short path can be selected; saturation still must be managed | Path length and band strength can be selected; detector/source nonlinearity still matters |
| Complexity | Laser/thermal/spectral control and algorithms can be demanding | Optics can be simpler, but source, filters, channels and drift still require engineering |
| Commercial outcome | Depends on wavelength components, volume, qualification and integration | Can be cost-effective in mature volume designs; actual instrument cost governs |
4. Start with the decision conditions
Gas matrix
Target species, concentration, water, CO₂, hydrocarbons and expected variations determine useful spectral regions and interference tests.
Pressure and temperature
State absolute-pressure and temperature envelopes, not only laboratory reference conditions.
Gas path
In-pipe versus extractive architecture can change delay, contamination and representativeness more than the optical technology.
Decision consequence
Trending, leak indication, process control and protective shutdown demand different diagnostics and evidence.
5. Counterexamples to common shortcuts
| Shortcut claim | Why it fails | Better question |
|---|---|---|
| “TDLAS has no interference” | Neighbouring lines, water, baseline effects and wrong line selection still exist | Which gas matrix and pressure band were tested, with what residual/error? |
| “NDIR is always cheaper” | Optical path, detector/filter channels, qualification volume and host integration determine cost | What is total instrument and lifecycle cost for this requirement? |
| “Laser means no calibration” | Line data do not remove path, detector, pressure, temperature, baseline or manufacturing variation | What calibration and verification maintain the stated result? |
| “NDIR cannot measure high concentration” | Path and absorption band can be designed for high concentrations | What upper-range evidence exists for the actual product and gas matrix? |
6. Build a fair side-by-side verification
Use the same traceable gas points, gas matrix, pressure, temperature, flow and step profile. Stabilise both instruments according to their manuals. Compare indication error, repeatability, drift, total response, recovery after over-range, pressure/temperature sensitivity, interference, diagnostics and maintenance. If one instrument is extractive and another in-pipe, report the gas-path difference instead of attributing it to the optical method.
For a control task, send both outputs through the intended host timing and scaling. For a field task, expose both to the real contamination and maintenance interval. A laboratory accuracy comparison alone cannot settle lifecycle suitability.
7. Minimum project inputs
- Target gas, range, normal band, background matrix and interferents.
- Absolute pressure, temperature, water content and flow conditions.
- Direct or extractive gas path, including conditioning and total response requirement.
- Required outputs, diagnostics, warm-up, power, size and environmental envelope.
- Decision function: indication, trending, control, alarm or protective action.
- Available evidence from the specific TDLAS and NDIR instruments to be compared.
Primary and official sources
Sources were checked for the specific claims used here. A cited source does not endorse Specval or establish product performance.
- Primary research: NDIR methane sensor design — broadband source, cell, filter/detector and signal-processing architecture.
- Sensors: TDLAS measurement compared with commercial NDIR instruments — product- and condition-specific comparative evidence.
- Sensors: NDIR gas-sensing review/research context — NDIR architecture and performance variables.
- Frontiers in Physics: TDLAS review — line selection, optical-path and demodulation variables.
Technical review date: 30 July 2026.