
Direct answer
Use absolute pressure and keep three envelopes separate.
Record minimum, normal and maximum pressure at the optical path in kPa absolute. Then check three different limits: the process-operating band, the band over which pressure compensation has been validated, and the mechanical survival or proof-pressure band.
A module fits only where the required bands overlap. Gauge pressure alone is ambiguous in a vacuum process, and a pressure-resistant housing does not prove spectroscopic accuracy.
1. Pressure enters both molecule count and spectral shape
For an isolated absorption transition, Beer–Lambert analysis relates transmitted intensity to the absorber amount, optical path and line shape. A useful simplified expression is:
At fixed mole fraction and temperature, total number density changes approximately with absolute pressure through the ideal-gas relation. Pressure also broadens absorption lines and can blend neighbouring features. The algorithm therefore cannot simply assume that a spectrum measured at atmospheric pressure has the same peak shape under strong vacuum or elevated pressure.
NIST high-resolution absorption work discusses Beer–Lambert modelling and pressure-broadened line blending. A methane TDLAS compensation study in Applied Optics likewise treats temperature and pressure as variables affecting retrieved concentration.
2. Express vacuum processes in absolute pressure
Absolute pressure is measured from a perfect vacuum. Gauge pressure is measured relative to local atmosphere. Their relationship is:
If local atmospheric pressure is 101 kPa and a pipeline reads −60 kPa gauge, the approximate absolute pressure is 41 kPa. At a high-elevation site with 85 kPa atmosphere, the same −60 kPa gauge indication would imply about 25 kPa absolute. A specification written only as “−60 kPa” therefore cannot define the optical condition.
3. Keep three pressure envelopes visible
| Envelope | Question answered | Evidence |
|---|---|---|
| Process operation | What pressure will gas at the measurement point actually reach? | Site data, design calculations and transient records |
| Compensation validity | Across what pressure band has concentration retrieval met the stated error? | Gas tests across pressure, temperature and concentration matrix |
| Mechanical integrity | What pressure can the cell, seals and fitting safely contain or withstand? | Design calculation, proof test and applicable pressure requirements |
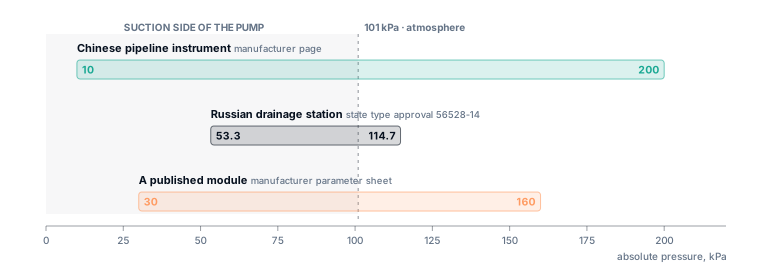
The current insertion-module target uses 20–200 kPa absolute for both process operation and compensation validity. That coincidence is a design goal, not permission to merge the claims. Mechanical proof and burst limits must be established separately, along with fitting and seal conditions.
4. Build a pressure verification matrix
A pressure-compensation test should cross more than one variable. At minimum, select low, normal and high absolute pressures; representative low, middle and high concentrations; and relevant temperatures. Use traceable gas preparation and pressure measurement, allow the cell to stabilise, and check both rising and falling pressure if hysteresis or transient response matters.
| Axis | Example points | Reason |
|---|---|---|
| Absolute pressure | 20, 40, 70, 100, 150, 200 kPa | Cover vacuum, atmospheric region and upper target |
| CH₄ concentration | Low segment, threshold region, normal high band, upper range | Pressure effects can interact with absorption strength |
| Temperature | Low, room and high operating points | Line strength and thermal control change with temperature |
| Direction / transient | Rising, falling and rate-limited steps | Check lag, pressure-sensor alignment and algorithm response |
A separate pressure sensor introduces its own location, calibration and time-alignment error. If pressure changes faster than the concentration and pressure signals are synchronised, a mathematically correct compensation model can still use the wrong instantaneous pressure.
5. Common failure modes
Gauge and absolute values mixed
A negative gauge range is copied into an absolute-pressure algorithm without adding atmospheric pressure.
Housing claim used as an accuracy claim
A cell survives 200 kPa, but the concentration model was only checked near 100 kPa.
Pressure measured at the wrong point
A remote transducer sees pump or restriction behaviour that differs from the optical cell.
Static tests used for a transient task
Step changes cause signal misalignment or condensation that never appears in a stable-point calibration.
6. Minimum project inputs
- Minimum, normal and maximum absolute pressure at the optical window.
- Expected rates of change, pulsation and pump-cycle transients.
- Local atmospheric pressure or elevation if field data are still in gauge pressure.
- Pressure-sensor type, range, accuracy, location, update rate and communication timing.
- Gas temperature, water content, condensation risk and background composition across the pressure band.
- Required mechanical design pressure, proof test, fitting, seal and applicable regulatory boundary.
Primary and official sources
Sources were checked for the specific claims used here. A cited source does not endorse Specval or establish product performance.
- NIST: high-resolution molecular absorption measurements — Beer–Lambert treatment and pressure-broadened line blending.
- NIST TDLAS measurement paper — absorption, number density and optical-path formulation.
- Applied Optics: temperature and pressure compensation for CH₄ TDLAS — primary research on pressure/temperature effects in concentration retrieval.
Technical review date: 30 July 2026.